February 8th, 2024
Beta Launch: Discover Table - Timeline View
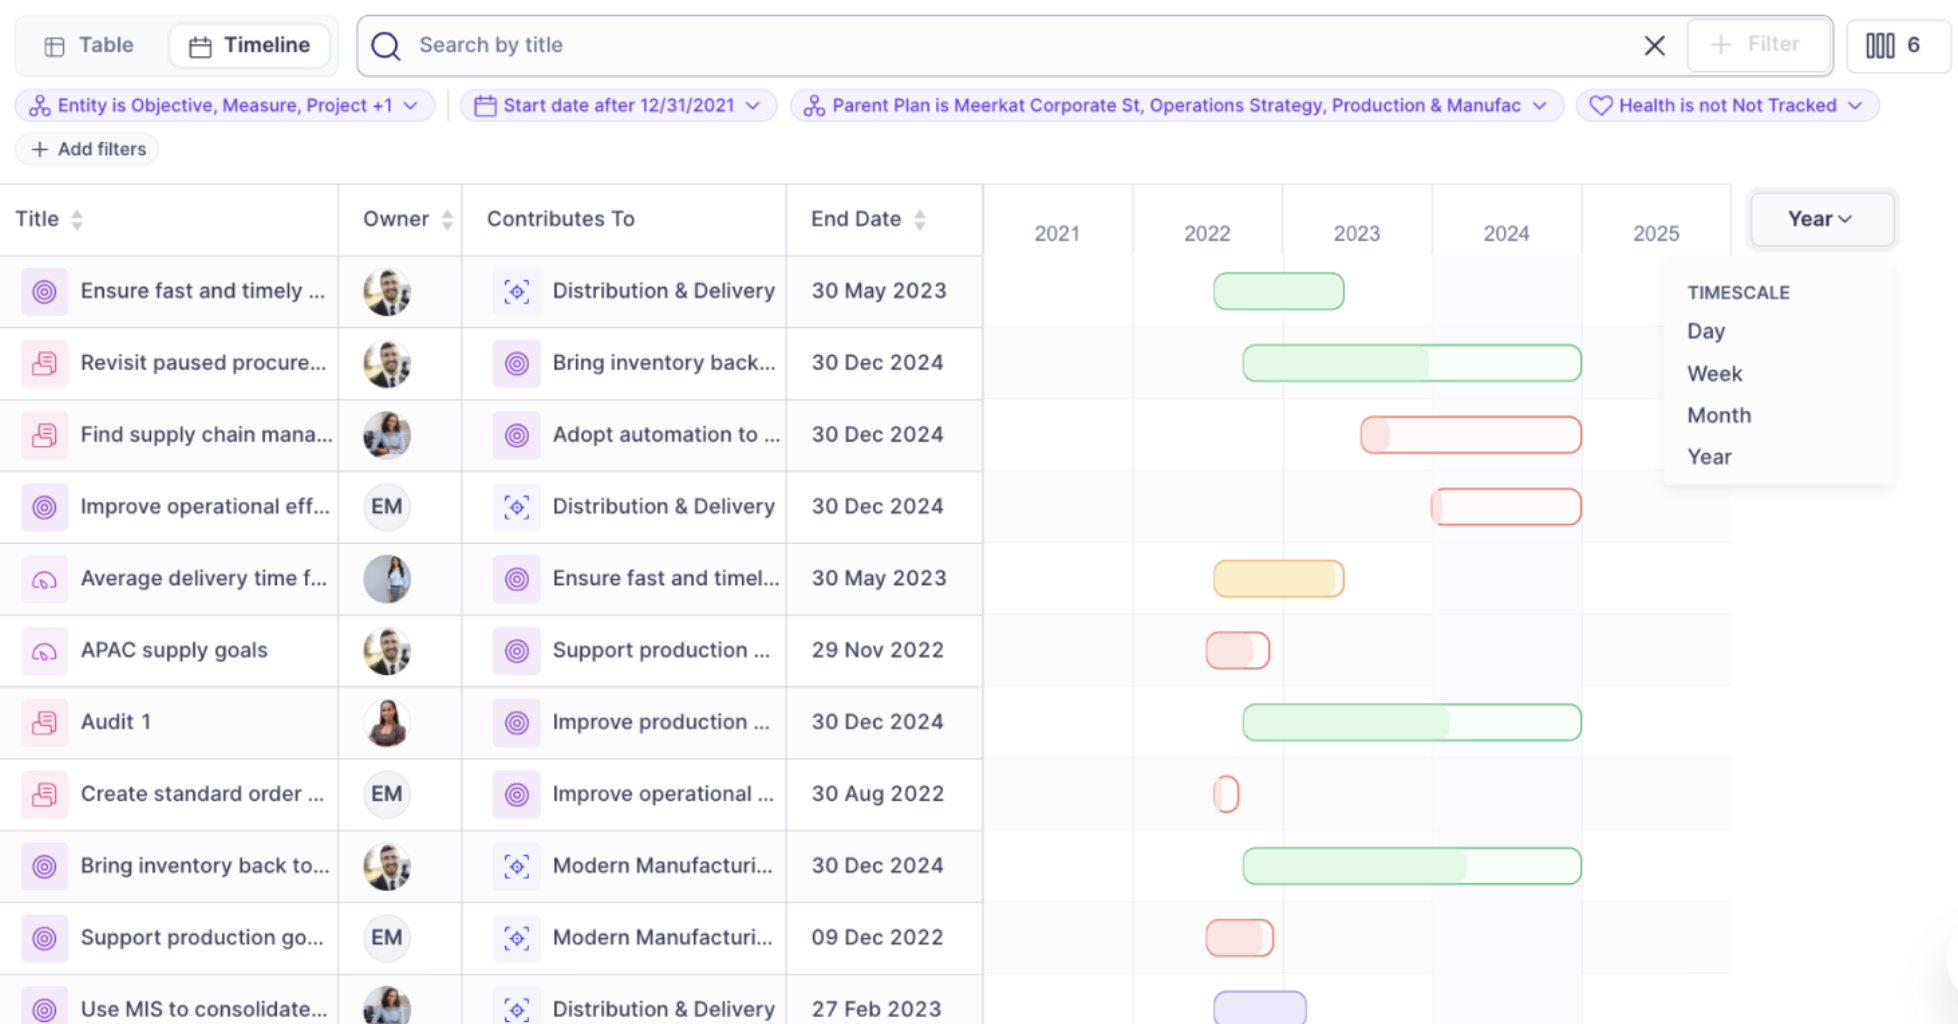
What is the Timeline View in Discover Table?
The Discover Table is our most dynamic reporting option yet - and now you can take this flexibility a step further by changing how your data displays to a timeline. The Timeline View allows you to review your Reports in a Gannt-style visual.
Timeline View is also available for PDF download should you want to export this visual to share with others.
How can I use the Timeline View?
Timeline View is ideal for any analysis you need to share around how programs of work interact or depend on one another.
Visualizing Timeline Dependencies: Showcase the relationships between the start and end date of various pieces of work.
Resourcing Reviews: Ensure teams committed to one program of work are not over-committed and that start and end dates properly reflect these constraints.
How do I set it up?
The Discover Table-Timeline View is available in Reports.
First, create a new Report or edit an existing Report.
Select the Discover Table icon in the top navigation bar while editing your report.
Use the drop-down menus to select the data source for your table.
Next, apply the necessary filters to your data set.
Select the required columns for your table by checking the box beside the relevant items.
Swap the view in the upper left from "Table" to "Timeline."
Adjust, as needed, the timeline grouping from monthly to daily and beyond.
Learn more about Discover Table - Timeline View.