The last two months have been all about giving you sharper insight and more control over how you see your data. We've rolled out a range of metrics improvements to help you break down your numbers exactly the way you need. We've also introduced a set of visual upgrades to reports, making them more customizable and easier to read at a glance. Finally, our AI Summaries have gotten smarter too, now doing a better job of sharing the right context when you need it.
Metrics V2 is new functionality that needs to be turned on by your CSM - if you're not seeing any of the functionality below in your Cascade instance, reach out to them to get it switched on.
New metric chart builder
Metrics can now be displayed visually with the new Metric Chart Builder. Turn any metric into a fully customizable chart in just a few clicks. choose from chart types like line, bar, area, and combo, layer in multiple metrics side by side, and switch between presets like Time, Period, and Dimension depending on the story you want to tell.
Fine-tune your view with date ranges, granularity, and stacking options, and pull in targets, budgets, and forecasts from the data sources panel to see performance against metrics at a glance.

Calculated formulas in Metrics & Facets
Metrics now include formulas for both calculated metrics and well as when configuring facets. Every formula comes with a plain-language explanation, including a summary of what it's doing, a step-by-step breakdown for nested or multi-part formulas, and a mathematical expression of the formula itself.

Historical Progress Columns
See how you're actually progressing over time, not just where you stand today. Add weekly, monthly, quarterly, or yearly progress snapshots right into your reports tables, so trends jump out at a glance instead of getting buried in a single "current value" column.
We've also added cell shading and variance, so you can instantly spot how each period compares to the last and see where you're gaining or falling behind.
You can also choose how big numbers display: Auto, Full, or abbreviated to Thousands (K), Millions (M), or Billions (B).

Note: Historical Progress Columns are available on Metrics V2 only.
Insights, visible to your whole workspace
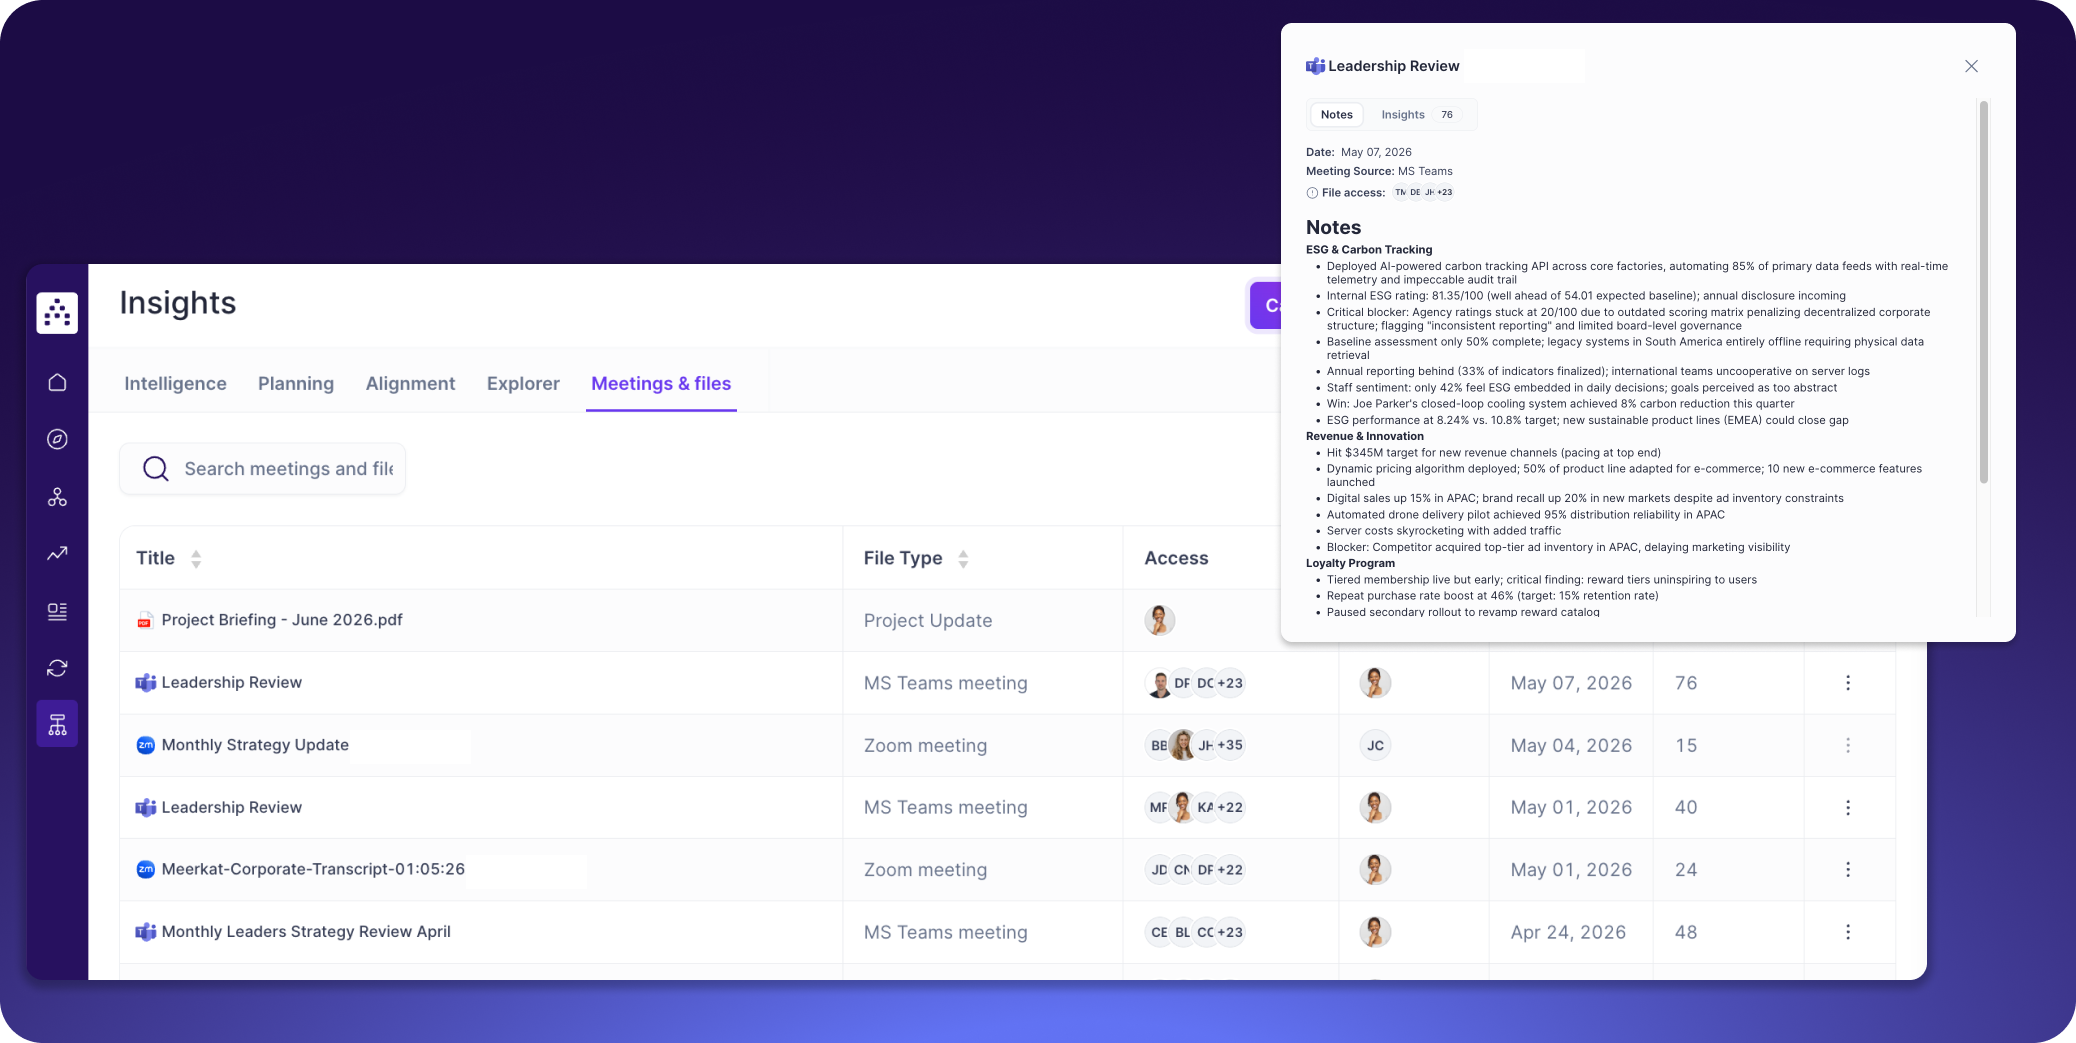
Alignment doesn’t need to depend on who was in the room. If you'd like, insights captured by Tapestry Connect can now be made visible to every user in your workspace, not just meeting attendees. They'll show up automatically in Objective summaries and Update suggestions, so your whole team can see what's actually happening across the business, whether or not it's made it into a formal update yet.
This is fully optional and toggleable by your Cascade team in Workspace Settings — just reach out to your CSM if you'd like it turned on.

Customizable Measure/Metric cards
There is now more control over how your key numbers display: turn off values shown on a card, improved number formatting throughout, full support for units and decimal precision on Mv2, and proper unit formatting on supporting numbers like Forecast, Budget, and Target.

Better AI summaries
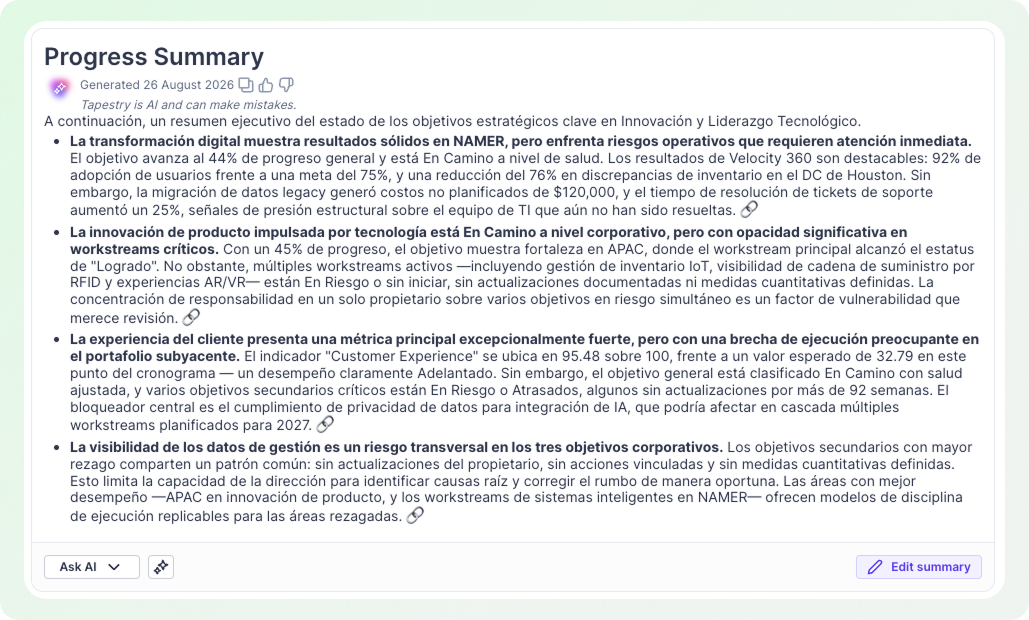
Summaries load significantly faster, Objective summaries now pull directly from insights with zero user intervention needed, and prompts better understand health status. We've also improved link reliability and moved to a richer, simpler, more positively-balanced format.
And summaries are now more likely to respond in the majority language of the report content. eg. if a an report has mostly Spanish updates the summary will now produce an Spanish summary, rather than defaulting to English.
Also shipped
Choose whether update reminders go to the Owner, Collaborators, or both, at the workspace level. Useful when execs own a goal but someone else on the team handles the actual updates.
Based on your feedback, the metrics library got a few nice quality-of-life improvements: new columns showing whether a Metric or Facet is Calculated or Raw, a filter on each table, and the ability to sort most columns.
We've renamed Reports to Reports & Dashboards, to reflect how most of you are already using them. If your workspace is one of the few still using Dashboards as a separate area, no change for you, that tab still reads "Reports."
Notable Fixes
Fixed Discover table performance issues that could crash reports on large tables
Fixed CSV export issues (line breaks, missing section labels, incorrect progress %, text trimming)
Fixed checklist dates shifting when editing or checking off items
Fixed compact mode hiding the "show more" button on updates
Tapestry Connect wasn’t processing meetings with transcripts taking over 2 hours to finalize, that has now been fixed